Introduction
VolatilityMarkets suggests top quant trade ideas to take advantage of trending markets.
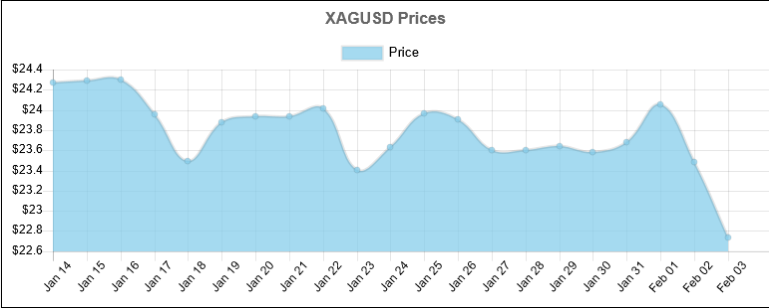
Market summary
XAGUSD last price was $ 22.7325. In the short term Silver has been accelerating lower. In the long term Silver has been accelerating lower. Over the past 20 days, the XAGUSD price increased 12 days and decreased 8 days. For every up day, there were 0.67 down days. The average return on days where the price increased is 0.5734% The average return on days where the price decreased is -1.6533% Over the past 20 Days, the price has decreased by -6.33% percent. Over the past 20 days, the average return per day has been -0.3165% percent. With the short term trend being the stronger of the two, we propose a short trade idea with an overnight time horizon.
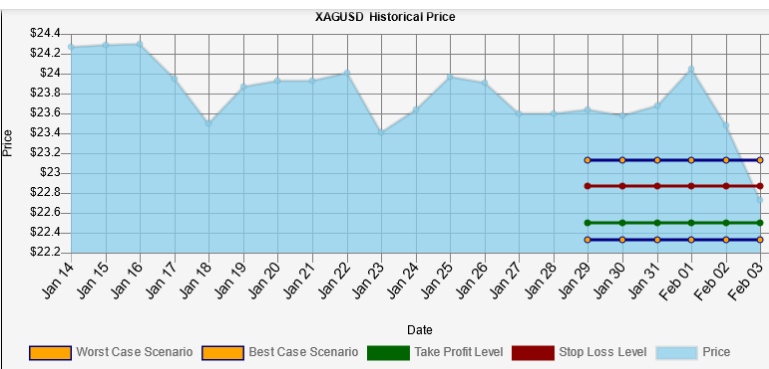
The trade idea
Sell $ 165,156 USD of Silver, take profit at $ 22.4972 level with 25.0% odds for a $ 1,709 USD gain, stop out at $ 22.8701 with 49.97% odds for a $ 1,000 USD loss through O/N time horizon.
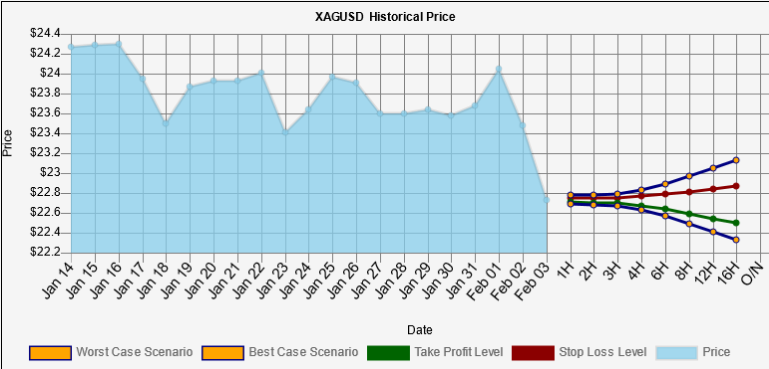
Intraday Predictions
XAG/USD trend analysis
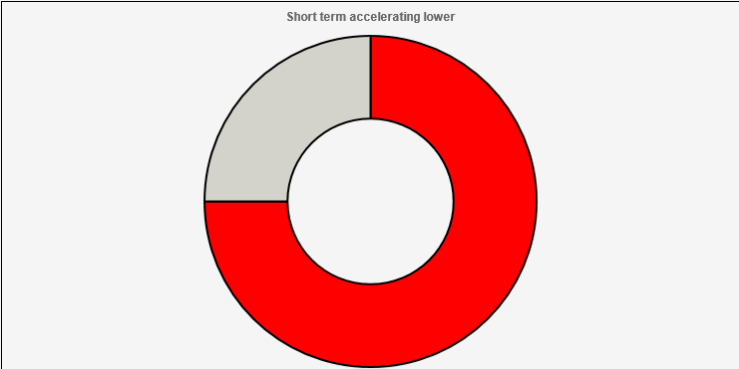
XAGUSD last price was $ 22.7325. The short term trend accelerating lower is stronger than the long term trend accelerating lower. This trade goes short when the last change was lower and accelerating.
XAG/USD value analysis
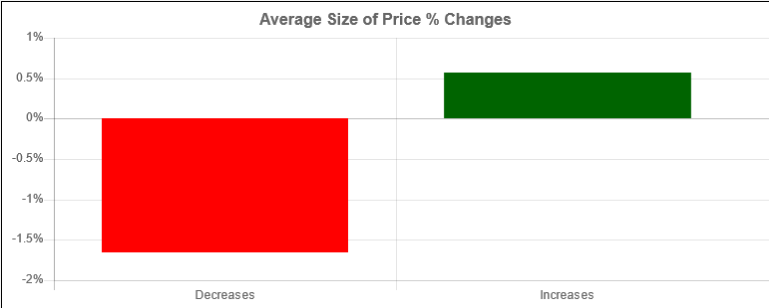
Over the past 20 days, the XAGUSD price increased 12 days and decreased 8 days. For every up day, there were 0.67 down days. The average return on days where the price increased is 0.5734% The average return on days where the price decreased is -1.6533% Over the past 20 Days, the price has decreased by -6.33% percent. Over the past 20 days, the average return per day has been -0.3165% percent.
XAG/USD worst/best case scenario analysis
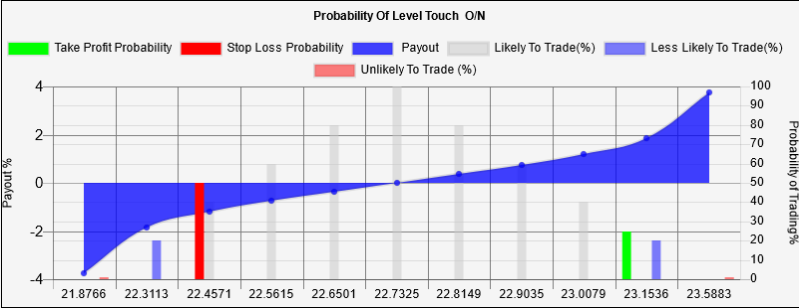
Within 1 week, our worst case scenario where we are 95% certain that this level won't trade for XAGUSD, is $ 22.3299 , and the best case scenario overnight is $ 23.1351 . levels outside of this range are unlikely, but still possible, to trade. We are 50% confident that $ 22.8701 could trade and that $ 22.4972 could trade. These levels are within statistical probability.
Key Takeaways:
-
Price today $ 22.7325
-
Over the past 20 days, the XAGUSD price increased 12 days and decreased 8 Days.
-
For every up day, there were 0.67 down days.
-
The average return on days where the price increased is 0.5734%.
-
The average return on days where the price decreased is -1.6533%.
-
Over the past 20 Days, the price has decreased by -6.33% percent.
-
Over the past 20 days, the average return per day has been -0.3165% percent.
-
Over the past 20 days, The price has on average been accelerating: $ 0.0383 per day lower.
-
Over the last session, the price decreased by $ -0.747145.
-
Over the last session, the price decreased by -3.2867 %.
-
Over the last session, the price accelerated by $ 0.1725.
 previous